- Rotator Studio Modeler
- Rotator OLAP Analyzer
- Rotator Manual Load (DataEntry)
- Rotator Telephone Station
- Rotator Sorting Station
- Kiosk Station
- Rotator Capture Supervisor
- Rotator Sorting Supervisor
- Rotator Mobile for Android
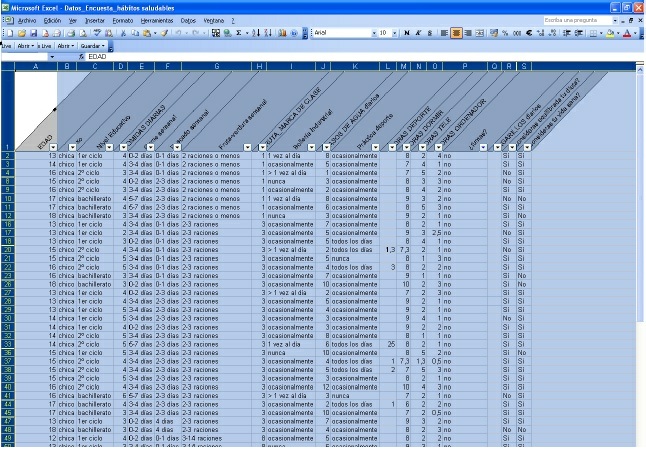
Many inexperienced users of survey data analysis underestimate the difficulty of the tabulation and analysis process and opt for the "easier" way: using the Microsoft Excel spreadsheet as a tool to contain the data and perform the data entry, quality control and analysis. However, this path, which initially seemed easy, will later turn into a long and tortuous carpentry process that will put at stake the quality of the study data as well as the delivery time of the results and the final report. Let's analyze in detail the advantages and disadvantages of Excel for survey management
- Easy to use and understand the Excel grid structure.
- Easy to initiate and understand data entry and tabulation process
- Low Excel price and is normally available on any PC.
- No special training is required and anyone who knows Excel can do it.
- When the survey has multiple choice questions, a column in Excel must be reserved for each possible answer. If each question has about 100 answer choices, then each question will use 100 columns in Excel, making the handling, storage and analysis of these types of questions extremely cumbersome, manual and time consuming.
- Since in Excel it is easy to mix the raw data (from the questionnaire) with the processed data, new columns must be added, which will alter the original database, producing multiple versions of the spreadsheet that will confuse users or require a version control methodology.
- When you have many variables and many subjects, say 2,000 variables and 30,000 subjects, Excel becomes slow and unmanageable.
- Although it is possible to program it, data validation becomes an odyssey and a challenge for the most experienced, for example validating date ranges, numeric ranges, time ranges, numbers of characters entered, acceptable data types, etc.
- Every column in Excel and every cell must be validated to ensure data quality. This usually slows Excel down and complicates the grid.
- Since Excel cannot network in multi-user mode; if you want to type between several transcribers, each transcriber must have a copy of the Excel sheet structure, so it is not possible to validate that the same questionnaire has been entered several times.
- If data is entered between several transcribers, each transcriber must have a copy of the spreadsheet, but what happens when the administrator must make a change, such as adding a question, deleting a response mode, etc...Well, the processing becomes a hell of copies and versions.
- The probability of making typing errors is high since Excel does not validate alphanumeric codes or numeric ranges unless programmed.
- If each Excel row is a case and each column is a variable, the data entry will be done horizontally, column by column. While the reading of the questionnaire is vertical. So the transcription process is tremendously slow and cumbersome. (The same thing happens in SPSS).
- In general, the quality of the data entered via Excel is questionable and the data must be taken to a third party tool such as SPSS to complete its review.
- The generation of statistics is very manual and the process is slow and painstaking..
- The generation of crosstabs, for example the count of smokers in zone X who prefer brand X is a difficult to obtain, the only way to achieve it in Excel is with Pivot Tables, however when the cigarette brands come from a multiple choice question, the pivot table is inoperative.
- Making a frequency table in Excel can take hours or days to obtain, which takes seconds in any specialized software such as "Rotator Study OLAP Analyzer".
- Thinking of creating a tabulation of all the variables of the study, crossed by city, stratum, sex, age, etc. can take days (or weeks in Excel), which will take a few minutes in any software specialized in survey analysis, such as "Rotator Survey OLAP Analyzer".
In general, users who have done more than one quantitative study and who have gone through these bad experiences, choose to use specialized software such as "RotatorSurvey", which guarantees them optimal data quality, substantial reduction of technical and human errors and the most important thing: considerable reduction of time and rework.