
INTEGRATION OF SURVEY DATA USING POWER BI
Power BI, along with Google Analytics, have become in recent years the preferred software tools in the corporate world for the analysis of data generated by internal business applications. This trend has been fostered by several factors; firstly, by the need for user-friendly, intelligent and shared dashboards on the Web that show data from various sources, whose structure is usually quite complex. Secondly, because traditional data analysis tools such as Excel, SPSS, as well as other OLAP and data mining tools, no longer meet the requirements of online data analysis and interoperability required by today's users.
Data from sales, finance (ERP), customer relationship management (CRM), production and quality control data, etc., are now analyzed in user-friendly and functional dasboards on intranets or on the internet, created and customized to meet the user's needs. PowerBI, Google Analytics and other online analytical tools provide data integration interfaces through a process called ETL (Extraction, Transformation and Loading). These are interfaces (software) that allow data to be extracted and loaded from their own source, whether they are in a proprietary database format, or whether they are text files, XML, XLS, CSV, SAV, etc.
FEEDING A POWER BI DASHBOARD WITH AN EXTERNAL SURVEY
Once the source data has been imported, or linked to the Power BI system, it is transformed, cleaned and fully prepared for further analysis. This initial preparation of the databases consists of eliminating redundant or unusable fields or records not usefull for the analysis, as well as bringing them to a unified and understandable format; eliminating complex relationships of relational databases through an automatic process of data denormalization. That is to say, if the data source contained for example, some 20 interrelated tables, these can be summarized to only 2 or 3 tables. Thus, internally PowerBI will create a large denormalized table (Datawarehouse) for the purpose of performing online analytical queries (OLAP) from the user-friendly interface or "Dashboard".
While denormalizing and preparing the niternal business data is often a complex and tedious process. Preparing external survey data for analysis in Power BI is much simpler and faster than you might think, since typically the survey data is already denormalized. That is, each record in the table will corresponds to an interview (case or questionnaire) and each field to a question or variable of the questionnaire. Additionally, the process of transforming coded survey data (along with its codebook) into a textual format understandable by PowerBi is well supported by most survey software tools including RotatorSurvey, QuestionPro, Qualtrics and SurveyMonkey.
INTEGRATING THE MARKET RESEARCH AGENCY INTO THE COMPANY'S VALUE CHAIN THROUGH POWERBI
Normally we want to create a dashboard in Power BI that allows us to display and cross-reference internal business data (sales, finance, production) with key performance indicators (KPIs). Many of these indicators come from external primary data obtained in the field, through surveys to consumers, clients, suppliers, etc. The need then arises to integrate the data generated by the Market Research Unit producing the data, which could be an internal department of our company, or an external Market Research Agency, which we have hired to provide us the primary data which will be collected (in questionnaires) through observation (Mystery Shopper) or by face-to-face interviews.
Let us assume the case of a company that sells soft drinks, which wants to build a executive dashboard to show the evolution of its sales month by month, so they can measure whether the investment made in advertising and marketing are having a positive effect on the business, both in the volume of product sales and in the gain of market share. Thus, we can hire an external Market Research Company to collect external data related to distribution, price, regions and channels where our brand and competitors brands are distributed ("Store Audit"). The supplier will conduct field surveys through surveyors. (CAPI Survey) to hundreds or thousands of stores through a random and representative sampling of the various marketing channels, which include wholesalers, super markets, large stores, grocery stores, small warehouses, etc., i.e., where the product or category is marketed. Week by week our supplier will feed a database located in its own office, the cost will be linked transparently and through an API (Application Interface) that will generate a standard XML structure to interoperate. Thus, the XML file generated by the external market research company will be automatically read by Power BI. In this way, every time there is new data (or changes) in the survey database, it will be reflected in our management dashboard. This way, we achieve a total integration of the survey provided by the research company with our Business Intelligence (BI) systems, which ultimately serves as an input for monitoring and management decision making in our company.
SOFTWARE TO COLLECTING SURVEY DATA AND INTEGRATION TO POWER BI
Currently almost all online survey software (SAaS) vendors provide interfaces to interoperate with any Business Intelligence tool, such as PowerBI or Google Analytics. Survey systems such as RotatorSurvey, Qualtrics, SurveyMonkey or QuestionPro include APIs to automatically deliver data in XML, SQL or other formats. However, our RotatorSurvey application is different from the rest because of multiple features that make it unique and attractive, both for the market research firm and the end client company. First, by supporting all capture methods, it is possible to collect data through paper surveys, offline and online kiosks, through online self-administered surveys, through face-to-face interviews (CAPI) and through telephone interviews. (CATI Survey). In addition, RotatorSurvey provides a unified, standardized and repeatable system for data processing, guaranteeing high quality data ready to be used by the client in their internal data analysis and decision making processes.
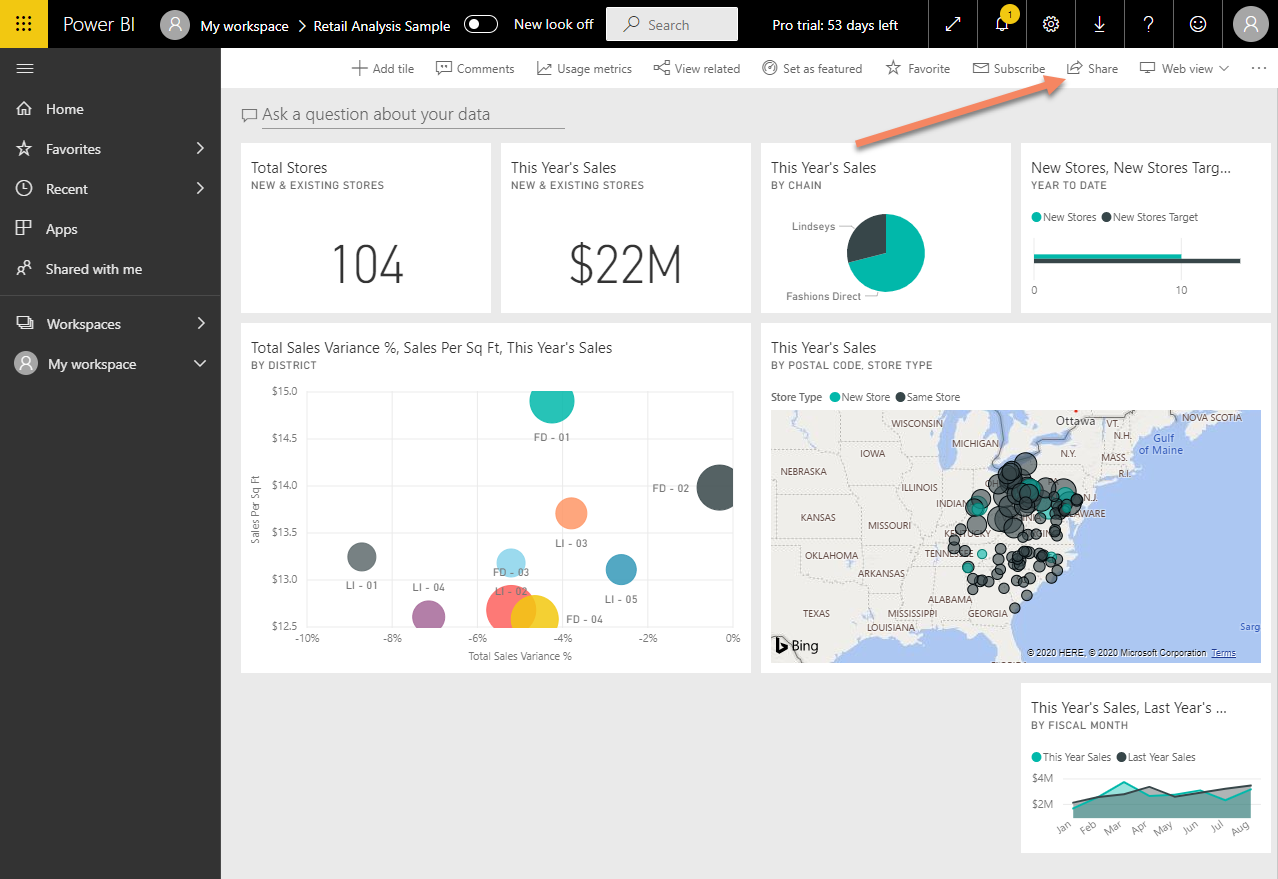
Analysing Survey Results with Power BI
Advanced Analytics with Power BI
Power BI Tutorial From Beginner to Pro in 60 Minutes