- Rotator Surveys Modeler
- Rotator OLAP Analizer
- Rotator DataEntry
- Rotator Phone Interview
- Rotator Classifier
- Rotator Kiosk Station
- Rotator Data Collection Supervisor
- Rotator Classification Supervisor
- Rotator Mobile for Android
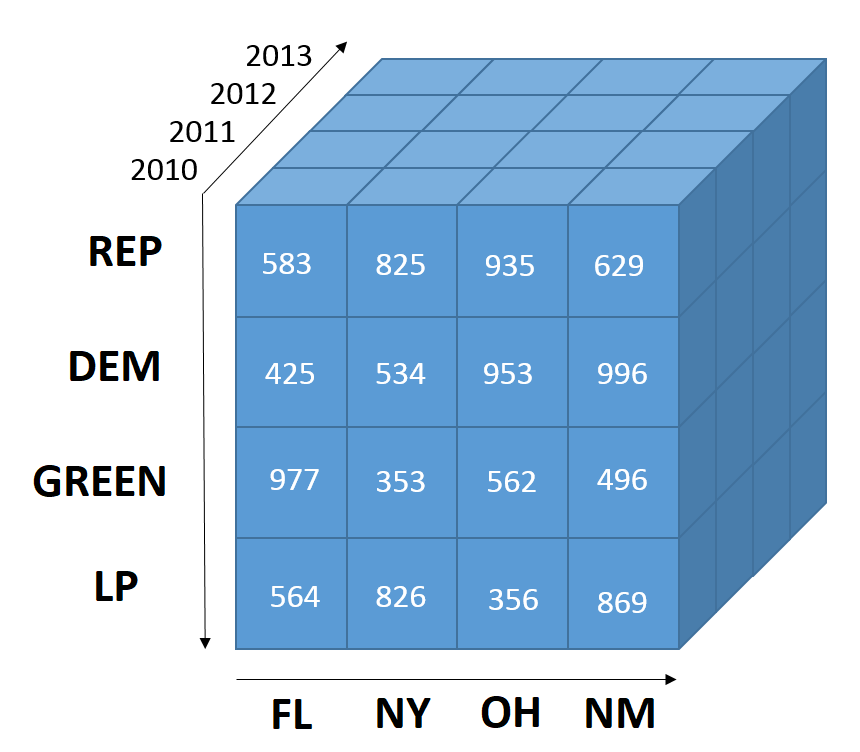
"Rotator OLAP Analyzer" is a software solution that allows you to analyze your surveys in a intelligent, efficient and productive way. "Rotator" is based on the OLAP technology (Online Analytical Processing), which gives an special treatment to a data that is multidimensional in nature, which is difficult to be modeled and analyzed on traditional data analysis tools. As an example, check below a data cube, in which you have three dimensions: Political party, Sex and County. Rotator internally creates this cubic structures to allow the analysis of combined dimensions: Party by Sex, Party by County, County by Sex and so on. Cubes created in Rotator can be n-dimensional and they are completely transparent to the user, who normally focuses on the information she or he needs rather than on how the data has been stored in the system.
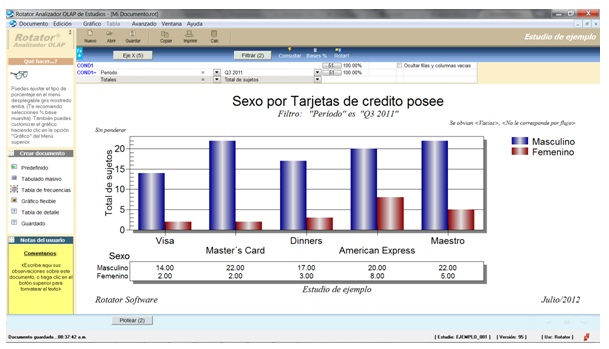
- An intuitive GUI allow users to be very productive.
- Any table or chart can be created intuitively in seconds.
- The information presented is clean and ready to be analyzed.
- Tables and charts can be exported to Microsoft Excel, Power without any hassle.
- The Analyzer provides a predefined set of analysis ready to be used.
- Complex frecuency reports can be built in seconds, which may take hours with traditional tools.
- Wizard forms allows the creation of complex analytical data structures.
- Rotator ensures the integrity of the data, reduction of human errors, speed and consistency of results.
Our software component "Rotator Analyzer OLAP" was designed to fairly meet the analytical needs of typical surveys, so it covers the basic descriptive statistics, with emphasis on the analysis of proportions and percentages of any kind, i.e. counts and relative frequencies in all forms and combinations. It also includes descriptive statistics such as average, minimum and maximum, standard deviation, mode, quartiles and percentiles and some statistical analysis of the normal curve. Thus, the Rotator OLAP Analyzer covers more than 90% of the requirements of the data analysis required by most market and opinion research companies. For those users interested in multivariate analysis and other forms of advanced statistics, such as cluster analysis, Anova, linear and multiple regression analysis, discriminant analysis, factor analysis, predictive statistics and data mining, the system allows data exportation to commercial formats and standards software packages such as Excel, SPSS and CSV, so that they can perform these multivariate analysis on these specialized statistical packages.
Based on the above said, our suite of tools for modeling and analyzing quantitative studies, is not intended to compete with traditional statistic packages, such as SAS, SPSS, R, etc., our main focus is on complementing the weaknesses of these tools, particularly in terms of modelling the data, data capturing and quality control of the different processes of the survey, as well as the substantial reduction of technical and human errors. This includes the design of the questionnaire for all collection methods and the complete systematization of the survey.